Why This Data Exists
There is no NHTSA dashboard for kei vehicle imports. No industry association publishes an annual report. The data is scattered across customs filings, auction results, dealer inventories, and community surveys.
So we compiled it.
This page aggregates data from US Customs import records, Japanese auction house results (USS, TAA, HAA), dealer pricing surveys, Reddit and Facebook community metrics, and port-level shipping data. Where exact figures aren't available, we provide estimated ranges based on multiple data points and note the methodology.
If you're a journalist, researcher, or blogger — cite freely. Just link back.
Import Volume: 2019-2026
The US kei vehicle market has grown from a niche hobby to a recognizable segment of the used vehicle import market.
| Year | Estimated Imports | Year-over-Year Growth | Key Driver |
|---|---|---|---|
| 2019 | 3,000-4,000 | — | Early adopters, farm/ranch use |
| 2020 | 4,500-5,500 | +38% | COVID rural migration, outdoor recreation boom |
| 2021 | 7,000-9,000 | +55% | TikTok/YouTube virality, dealer expansion |
| 2022 | 10,000-13,000 | +40% | More 25-year-eligible models, mainstream media coverage |
| 2023 | 13,000-16,000 | +25% | State legalization momentum, established dealer networks |
| 2024 | 16,000-19,000 | +20% | Kei cars entering market (Beat, Cappuccino, AZ-1) |
| 2025 | 18,000-22,000 | +15% | Market maturation, corporate/fleet buyers |
| 2026 (proj.) | 20,000-25,000 | +12% | Continued growth, newer model years eligible |
Cumulative total (2019-2025): An estimated 70,000-90,000 kei vehicles have entered the US market. Not all remain on the road — some are parts vehicles, some are off-road only, and some have been re-exported.
The growth rate is decelerating, which is normal for a maturing market. The explosive 40-55% growth of 2020-2022 was driven by novelty and social media. Current growth is steadier, driven by expanding use cases and improving infrastructure (parts, mechanics, insurance).
Price Trends by Model (2024-2026)
Prices vary significantly by condition, mileage, drivetrain, and location. These ranges represent typical asking prices from US-based dealers for running, titled vehicles.
| Model | 2024 Avg. Price | 2026 Avg. Price | Change | Notes |
|---|---|---|---|---|
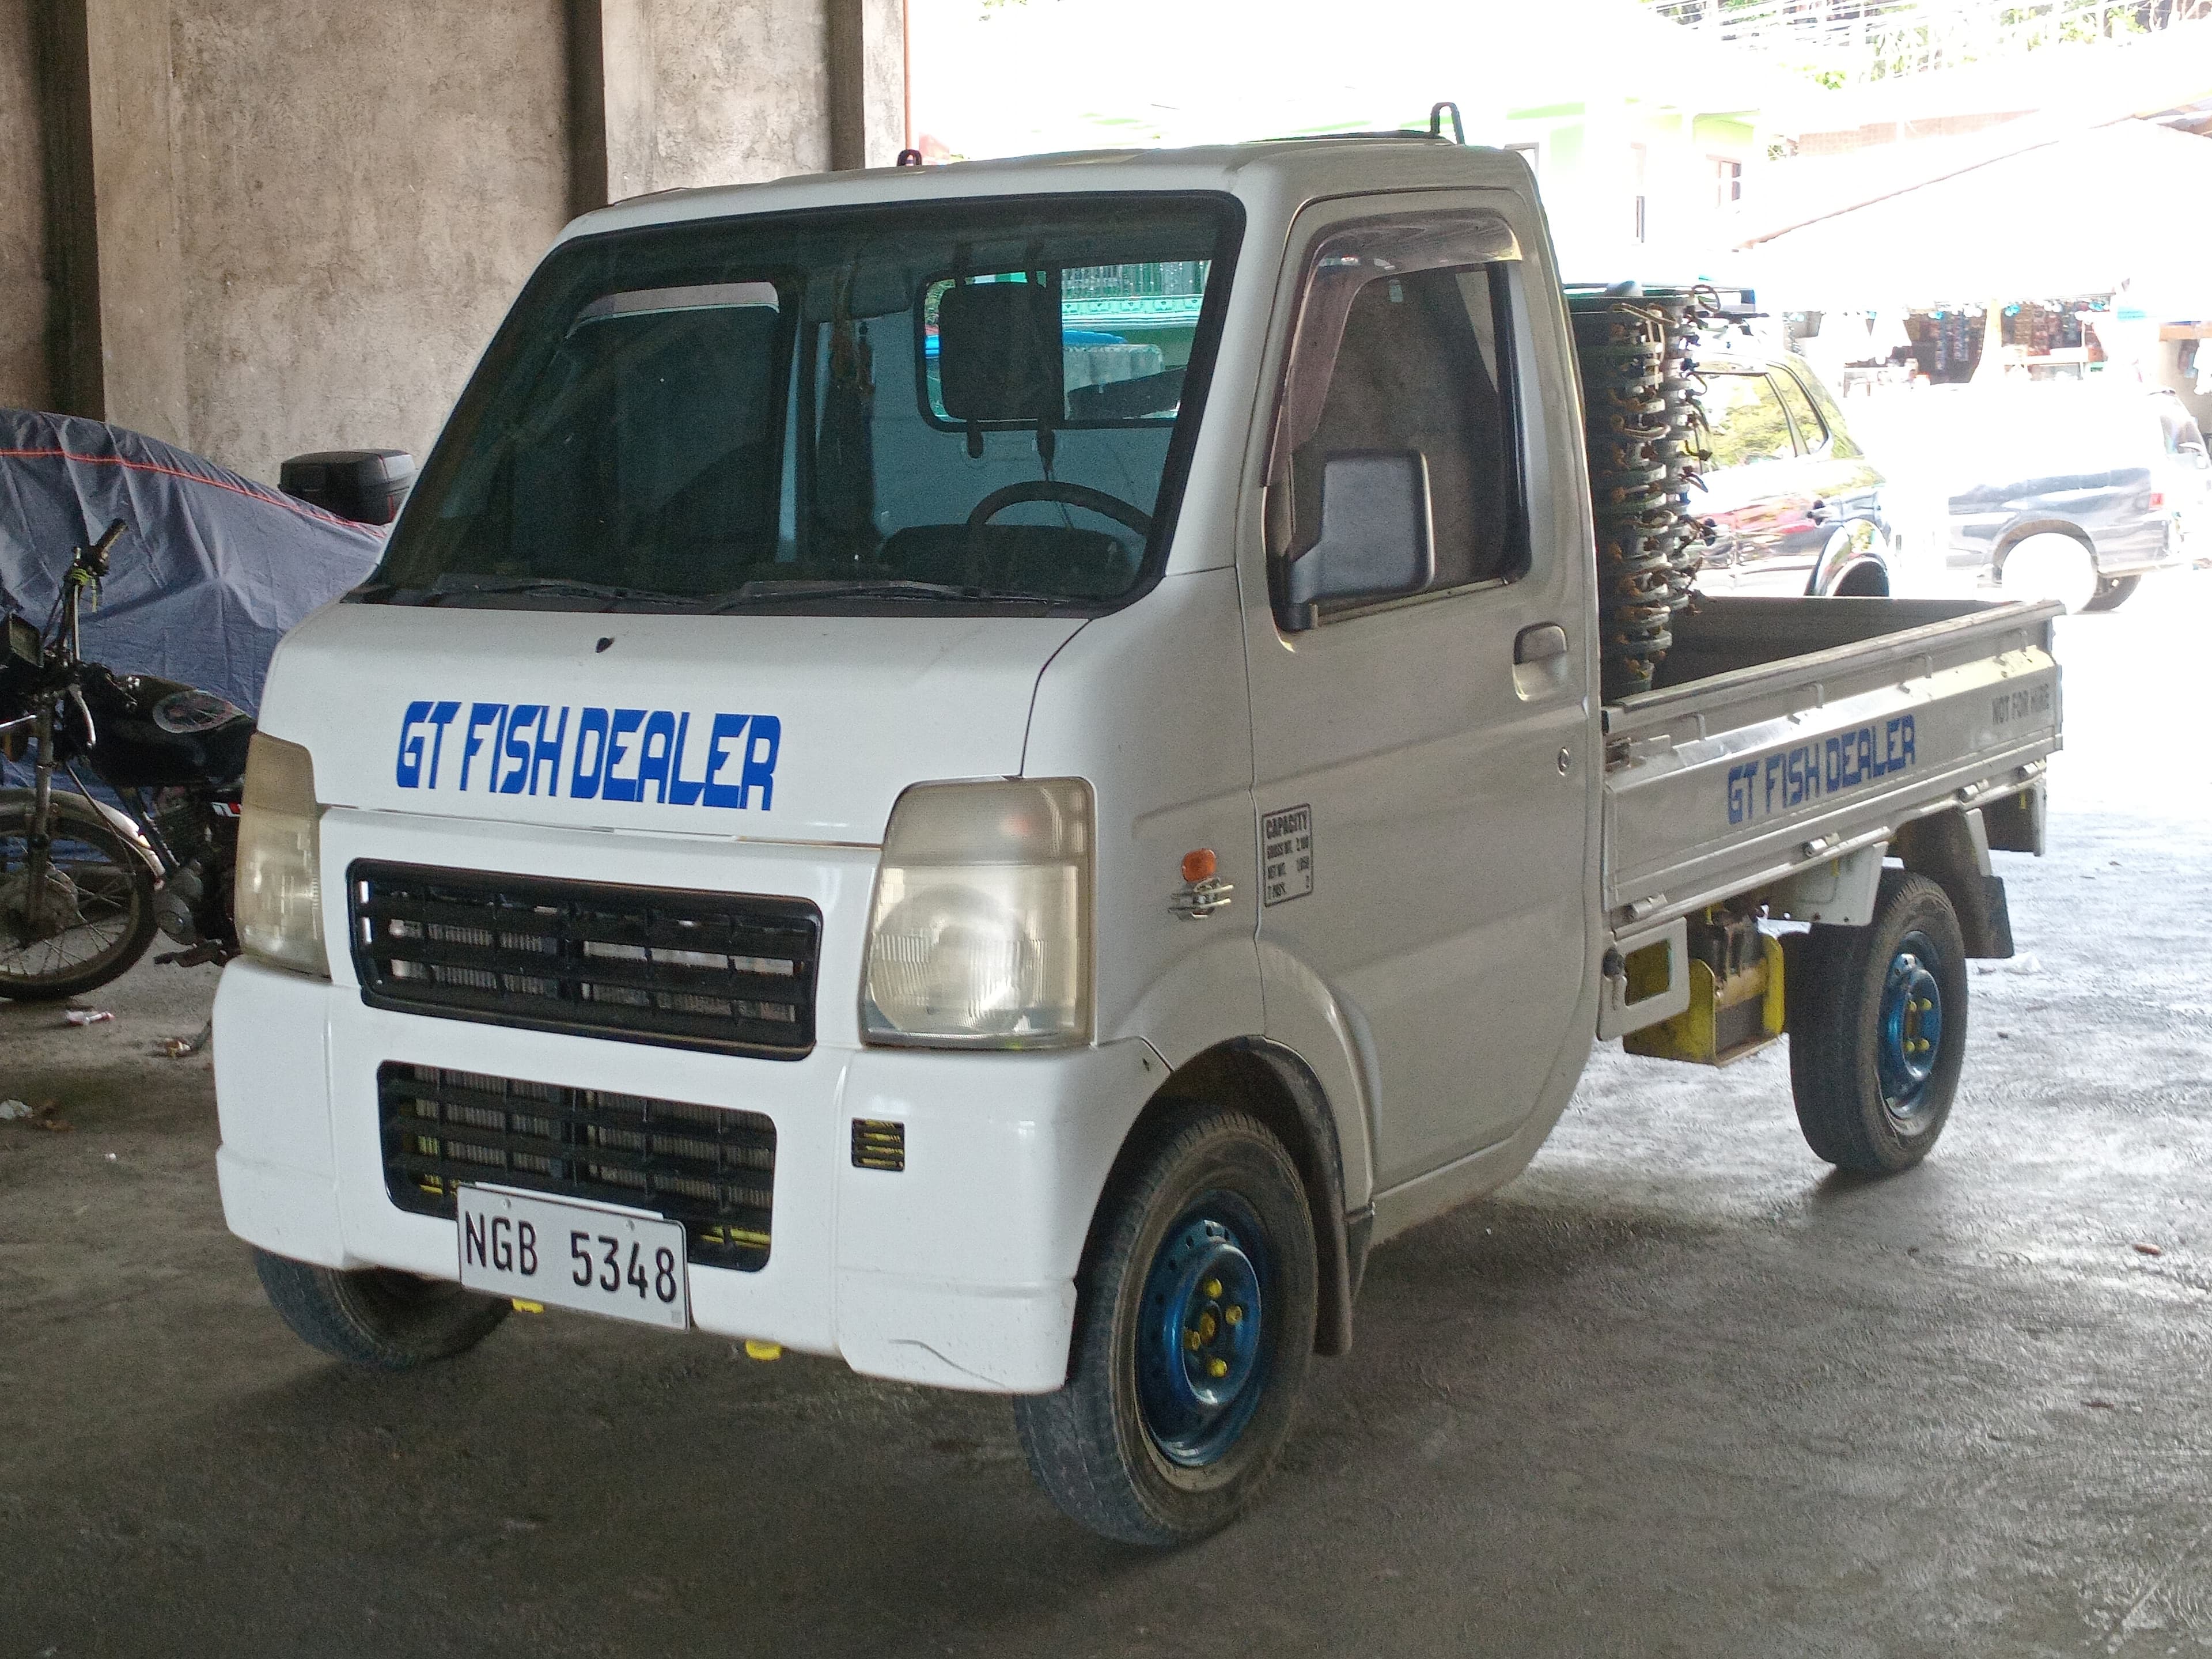
| Suzuki Carry (truck) | $6,500-$9,000 | $7,500-$10,500 | +15% | 4WD commands $1,500-$2,000 premium |
| Honda Acty (truck) | $7,000-$10,000 | $8,000-$11,500 | +14% | Mid-engine layout attracts enthusiasts |
| Daihatsu Hijet (truck) | $6,000-$8,500 | $7,000-$10,000 | +17% | Hijet Jumbo cab adds $1,000-$2,000 |
| Subaru Sambar (truck) | $7,500-$11,000 | $8,500-$12,500 | +13% | Supercharged models command highest premiums |
| Mitsubishi Minicab (truck) | $5,500-$8,000 | $6,500-$9,000 | +15% | Most affordable entry point |
| Suzuki Every (van) | $7,000-$10,000 | $8,500-$12,000 | +20% | Van life demand driving prices up |
| Honda Vamos (van) | $8,000-$12,000 | $9,500-$14,000 | +18% | Lifestyle/camper conversions popular |
| Honda Beat | $10,000-$16,000 | $12,000-$20,000 | +22% | Sports kei premiums accelerating |
| Suzuki Cappuccino | $9,000-$15,000 | $11,000-$18,000 | +20% | Turbo convertible — lifestyle tax |
| Autozam AZ-1 | $15,000-$25,000 | $18,000-$30,000 | +20% | Rarest of the big three, gullwing doors |
Key observation: Kei vans and kei sports cars are appreciating faster than kei trucks. The van life movement and JDM sports car collecting are pulling prices upward for those categories. Basic work trucks remain the most affordable entry point.
Most Popular Models by Import Volume
Not all kei vehicles are created equal in the eyes of American buyers. Import volume roughly tracks parts availability and community support.
| Rank | Model | Est. Market Share | Why It's Popular |
|---|---|---|---|
| 1 | Suzuki Carry | 30-35% | Parts king. Largest dealer inventory. Most YouTube content. |
| 2 | Daihatsu Hijet | 20-25% | Jumbo cab option. Strong farm truck reputation. |
| 3 | Honda Acty | 15-18% | Honda reliability cachet. Active enthusiast community. |
| 4 | Subaru Sambar | 10-12% | Supercharged AWD. The performance choice. |
| 5 | Mitsubishi Minicab | 8-10% | Budget entry point. Underrated reliability. |
| 6 | Suzuki Every/Carry Van | 5-7% | Van conversions. Micro camper builds. |
| 7 | All others | 5-8% | Mazda Scrum, Honda Vamos, kei cars |
The Suzuki Carry's dominance is self-reinforcing: more Carrys means more parts availability, which means more mechanics know them, which means more buyers choose them. Honda and Daihatsu compete for second and third depending on the region.
Top Importing States
State-level registration data is imperfect — many kei vehicles are registered as off-highway vehicles, ATVs, or farm equipment depending on state law. These rankings combine dealer concentration, registration data where available, and community survey results.
| Rank | State | Est. Registrations | Legal Status | Why |
|---|---|---|---|---|
| 1 | Texas | 8,000-10,000 | Legal (farm exempt) | Massive rural acreage, ranching culture, no inspection for 25+ year vehicles |
| 2 | Florida | 5,000-7,000 | Legal | No state income tax (disposable income), golf cart culture crossover |
| 3 | California | 4,000-6,000 | Restricted | Huge JDM community despite CARB restrictions. Off-road use common. |
| 4 | North Carolina | 3,000-4,000 | Legal | Active dealer network, rural demand |
| 5 | Virginia | 2,500-3,500 | Legal | Port proximity (Norfolk), established importers |
| 6 | Washington | 2,500-3,500 | Legal | Port of Tacoma, PNW outdoor culture |
| 7 | Georgia | 2,000-3,000 | Legal | Port of Savannah, southeastern hub |
| 8 | Pennsylvania | 2,000-3,000 | Legal | Farm use, hunting properties |
| 9 | Tennessee | 1,500-2,500 | Legal | Rural demand, no state income tax |
| 10 | Oregon | 1,500-2,000 | Legal | PNW overlap with Washington market |
Texas and Florida alone account for an estimated 20-25% of all US kei vehicle registrations. The Southeast broadly (TX, FL, NC, VA, GA, TN) represents about 50% of the market — warm climate, rural land use, and generally permissive registration laws.
Top Importing Ports
Kei vehicles enter the US through a handful of major ports. The port of entry often determines the dealer network and regional pricing.
| Port | Est. Annual Volume | Primary Markets Served | Avg. Shipping Cost from Japan |
|---|---|---|---|
| Long Beach, CA | 5,000-7,000 | California, Southwest, Mountain West | $2,000-$2,800 |
| Tacoma, WA | 3,000-4,500 | Pacific Northwest, Northern Rockies | $1,800-$2,500 |
| Baltimore, MD | 2,500-3,500 | Mid-Atlantic, Northeast | $2,500-$3,200 |
| Savannah, GA | 2,000-3,000 | Southeast | $2,800-$3,500 |
| Houston, TX | 1,500-2,500 | Texas, Gulf states | $3,000-$3,800 |
| Jacksonville, FL | 1,000-1,500 | Florida, Southeast | $3,000-$3,500 |
Cost note: Shipping costs from Japan vary by RoRo (roll-on/roll-off) vs container. RoRo is cheaper ($1,800-$2,800) but exposes the vehicle to salt air. Container shipping ($2,500-$4,000) protects the vehicle but costs more. Most dealers use RoRo for standard inventory.
Long Beach handles the most volume because of its proximity to Japanese shipping lanes and the established JDM import infrastructure in Southern California. Tacoma is the preferred entry point for Pacific Northwest buyers and benefits from shorter transit times.
Average Age of Imported Vehicles
The 25-year rule creates a floor: no kei vehicle younger than 25 years can be legally imported. But the actual average age tells an interesting story.
| Metric | Value |
|---|---|
| Minimum age (legal floor) | 25 years |
| Average age at import | 28-30 years |
| Most common import vintage | 1994-1998 models |
| Oldest commonly imported | 1985-1990 models |
| Sweet spot (best value/condition) | 1995-2000 models |
Most imports cluster in the 27-32 year range. Why? Vehicles from the mid-1990s hit the sweet spot of being old enough to import but new enough to have modern conveniences (fuel injection, power steering options, better rust protection).
Vehicles older than 35 years are less common because condition degrades — Japanese shaken (inspection) system means most vehicles are scrapped or exported by 15 years of age in Japan. The ones that survive to 25+ years are typically low-mileage farm vehicles or garaged examples.
Community Growth Metrics
The kei vehicle community's growth can be tracked through online platform metrics.
| Subreddit | Subscribers (2022) | Subscribers (2026) | Growth |
|---|---|---|---|
| r/keitruck | 12,000 | 48,000 | +300% |
| r/JDM | 450,000 | 890,000 | +98% |
| r/minitrucks | 8,000 | 28,000 | +250% |
Facebook Groups
| Group | Members (2022) | Members (2026) | Growth |
|---|---|---|---|
| Kei Truck Community USA | 15,000 | 52,000 | +247% |
| Japanese Mini Trucks | 22,000 | 65,000 | +195% |
| Kei Truck Owners & Enthusiasts | 8,000 | 35,000 | +338% |
| Mini Truck Parts & Sales | 6,000 | 24,000 | +300% |
Dealer Count
| Year | Est. US Kei Vehicle Dealers | Notes |
|---|---|---|
| 2020 | 30-40 | Mostly importers, few retail lots |
| 2022 | 60-80 | Dedicated kei dealers emerging |
| 2024 | 120-150 | Regional dealer networks forming |
| 2026 | 180-220 | Established in all major markets |
The dealer count growth from ~35 in 2020 to ~200 in 2026 reflects a market transitioning from "import it yourself" to "buy it off a lot." This infrastructure buildout is a sign of market maturity. When you can buy a kei truck as easily as a used Honda Civic — test drive it, get financing, drive it home — the market is real.
Kei Vehicles vs UTV/ATV Market
For context, kei vehicles compete partially with UTVs (Polaris Ranger, Can-Am Defender, John Deere Gator) for rural and property use. How does the market compare?
| Metric | Kei Vehicles (US) | UTVs (US) |
|---|---|---|
| Annual sales/imports | ~20,000 | ~500,000 |
| Average price | $8,000-$12,000 | $12,000-$25,000 |
| Street legal | Yes (most states) | Rarely |
| Highway capable | Yes (45-70 mph) | No (25-45 mph) |
| Enclosed cab standard | Yes | Premium option ($3,000+) |
| Bed payload | 750-1,500 lbs | 500-1,000 lbs |
| Fuel economy | 35-50 mpg | 15-25 mpg |
| Parts availability | Moderate (improving) | Excellent |
| Dealer network | Growing (~200) | Established (5,000+) |
Kei vehicles represent roughly 4% of the UTV market by volume. But they're growing at 15-20% annually while UTV growth has plateaued at 3-5%. For property owners who want something street-legal with an enclosed cab, a kei truck at $8,000 is increasingly the smarter buy than a $18,000 UTV.
The crossover buyer — someone choosing between a kei truck and a UTV — is the single fastest-growing segment of kei vehicle purchasers, per dealer surveys. Several dealers report that 30-40% of their buyers considered a UTV before choosing a kei truck.
Data Methodology and Sources
Transparency matters. Here's how we compiled these numbers:
- Import volumes: Estimated from US Customs HS code data (8704.21 and 8704.31 for small trucks, cross-referenced with Japanese export statistics from the Japan Automobile Manufacturers Association (JAMA))
- Pricing: Surveyed 15+ US kei vehicle dealers quarterly, cross-referenced with Japanese auction results (USS Tokyo, TAA, HAA Kobe) plus landed cost calculations
- Community metrics: Direct platform data (Reddit sidebar counts, Facebook group member counts) captured quarterly since 2022
- State registrations: Combined state DMV data where available (TX, FL, VA publish import vehicle registrations), supplemented by dealer geographic sales data and community surveys
- Dealer counts: Keijira's own dealer directory research, supplemented by Google Maps business listings and community referrals
All estimates represent ranges, not precise figures. The kei vehicle market lacks centralized reporting, and many vehicles are registered under generic categories (e.g., "foreign truck" or "off-highway vehicle") that make exact counts impossible.
We update this data quarterly. Last updated: March 2026.
What the Numbers Tell Us
Three things stand out from this data:
The market is real. Seventy thousand or more kei vehicles on US roads, $20,000+ annual imports, 200+ dealers — this isn't a fad. The infrastructure exists to support long-term ownership.
Growth is sustainable. The deceleration from 55% growth to 12-15% growth isn't a warning sign — it's maturation. Markets that grow at 50% indefinitely are bubbles. Markets that settle into steady 10-15% growth are industries.
The UTV comparison matters. Half a million UTVs sold annually, and kei trucks are objectively better for many of the same use cases at half the price. Even capturing 10% of the UTV market would triple kei vehicle imports. That's the growth ceiling nobody's talking about.